Leakage without Harm: Operationalising ‘No Significant Risk’
The EU CCS Directive requires storage developers to demonstrate that a proposed site has no significant risk of leakage and no significant risk to human health or the environment. However, “leakage risk” is conceptually distinct from harm-based risk: leakage undermines long-term containment even when there is no harm realised – it is a containment integrity concern. Moreover, what constitutes significant leakage or harm is not sharply defined in regulations or guidance, leaving room for interpretation. Here we propose a pragmatic method and criteria for judging “significance” that regulators can defend and operators can implement; a pragmatic framework that assesses leakage separately from harm, using familiar risk matrix mechanics combined with leakage-specific severity and likelihood scales.
A HIGH REGULATORY BAR FOR STORAGE INTEGRITY
EU law only permits storage site selection where there is no significant risk of leakage and no significant environmental or health risks exist. Leakage is defined as any release of CO2 from the storage complex, and ‘significant risk’ is defined as a combination of probability and magnitude of damage that cannot be disregarded without undermining the Directive’s purpose for the storage site concerned.
This legal test sets a very high bar for the integrity of a storage complex. For a project to proceed, the proposed CO2 storage site must be shown, to a high level of confidence, to be extremely secure – effectively a de minimis risk. And the challenge is not only a technical concern for the project. Regulators must defend permitting decisions under public consultation, European Commission scrutiny, and potentially litigation. Real-world deployment has shown that public confidence, legal challenge, and perceived regulatory robustness can become decisive for first-of-a-kind CCS developments – for example, the cancellation of the Barendrecht project following local opposition, the legal challenge and delay associated with the Porthos project, and the appeal against permits for the Aramis project.
The governance stakes are further intensified: identified leakage carries monitoring, reporting, and emissions-accounting consequences under the EU Emissions Trading Scheme framework. Operators and regulators therefore need risk arguments that are transparent, comparable, and defensible under significant uncertainty – not merely technically plausible. That is why a practical interpretation of ‘no significant risk’ matters.
THE THREE DIMENSIONS OF ‘NO SIGNIFICANT RISK’
The Directive contains three distinct dimensions of significance: risk to human health, risk to the environment, and risk of leakage.
Risks to human health and the local environment are familiar – they depend on exposure, harm mechanisms, and receptor vulnerability. Leakage risk is different. It is a containment performance issue: it concerns loss of long-term storage integrity and, therefore, the extent to which the climate purpose of geological storage is undermined. The IPCC’s Special Report on Carbon Dioxide Capture and Storage helps clarify this by distinguishing between local risks and global risks.
A leak may therefore be significant even where it does not immediately cause harm to people or ecosystems. A subsurface leakage event that does not reach the atmosphere and does not cause material local harm may still damage confidence in the storage complex, trigger regulatory intervention, create financial and legal implications, and call into question whether the project is delivering secure permanent storage.
It would be wrong to treat every tiny leak as automatically intolerable regardless of consequence, or every extremely improbable large leak scenario as a project-ending event regardless of likelihood. The significance of the leakage risk must therefore depend on both magnitude and probability.
A workable interpretation is that ‘significant risk of leakage’ means any leakage risk that meaningfully undermines confidence in permanent CO2 storage. In practice, this will tend to be a risk for which the mass of CO2 escaping containment, expressed as a percentage of the stored mass, is large enough to erode either the climate benefit of storage or regulatory confidence in the storage complex. Risked mass is a useful measure because it includes both a magnitude (mass of CO2 leaked) and probability (likelihood of that specific mass being leaked).
REFRAMING CONSEQUENCE AND LIKELIHOOD FOR LEAKAGE
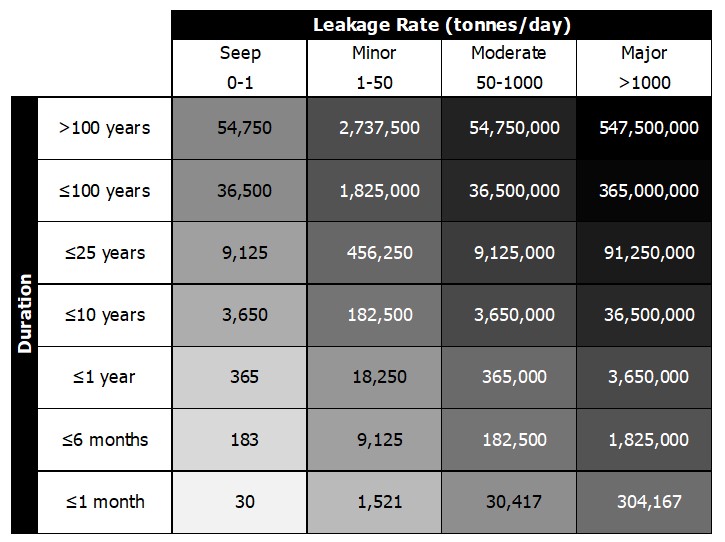
A leakage-focused severity scale must be based on the physical characteristics of leakage rather than on harm endpoints, because leaks that do not result in harm can occur and may still be significant. The most defensible basis is a two-dimensional characterisation of leak rate (mass per unit time) and duration (Figure 1).
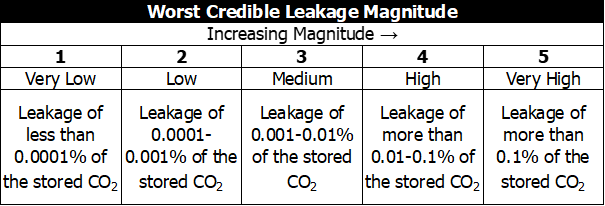
Together, these define the leakage magnitude (tonnage) for a scenario, regardless of the fate of the CO2 and any associated harm. The tonnage can then be categorised, typically using order-of-magnitude bands (Figure 2) that are calibrated specifically for the project, to produce a leakage magnitude (severity) score. This provides a consistent basis for comparison across leakage scenarios (wells, faults, caprock breaches, overfill events, and other pathways).
Health, environmental, and other (e.g. financial, reputational) harm can then be assessed separately using an annualised scenario-based risk matrix consistent with the existing project or company risk framework (Figure 3).
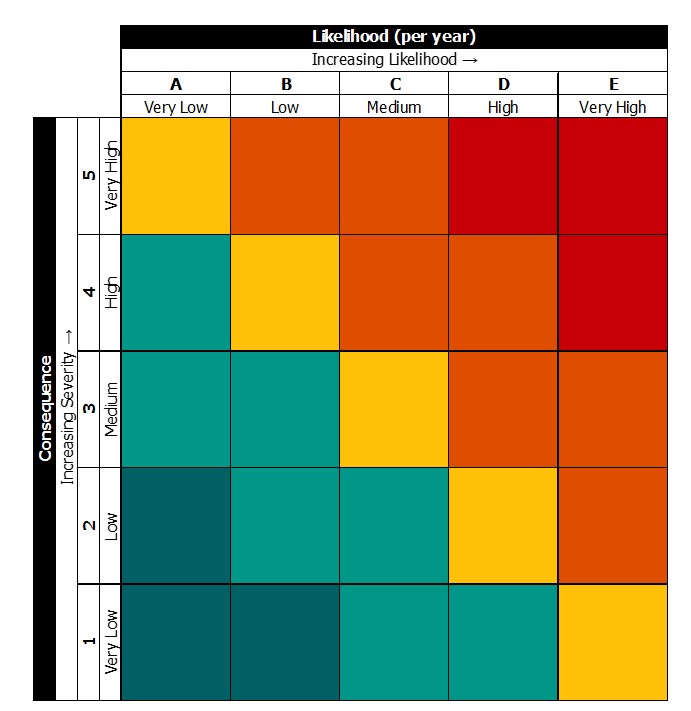
The risk of leakage can then be assessed using the familiar consequence-versus-likelihood matrix structure, but with consequence couched in terms of leakage magnitude rather than harm. This retains the familiar mechanics of risk ranking while ensuring that the consequence dimension properly reflects containment failure. Without this reframing, scenarios with limited local harm but material containment failure may be understated.
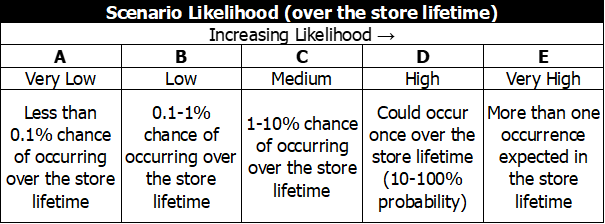
The test of leakage significance applies in aggregate over the lifetime of the store. Accordingly, scenario likelihood should be expressed not as an annual probability (frequency), but as the probability of the scenario occurring over the lifetime of the store, or over the relevant phase or phases during which that scenario is credible. This distinction matters because the applicability of a scenario may change over time. For example, leakage during well workover is only relevant while such activities are undertaken and before well abandonment, whereas leakage via a poorly abandoned well becomes relevant after abandonment and may persist over much longer timescales. It is therefore convenient to categorise likelihood using order-of-magnitude bands expressed on a store lifetime basis.
RISKED MASS AS A SEMI-QUANTITATIVE LEAKAGE METRIC
A practical semi-quantitative metric for comparing scenarios is the expected leaked mass, termed here the risked mass:
Risked mass = (leak rate × leak duration) × probability over the lifetime of the store
This yields an expectation value for the leaked mass associated with a scenario, which should be reported together with appropriate uncertainty ranges.
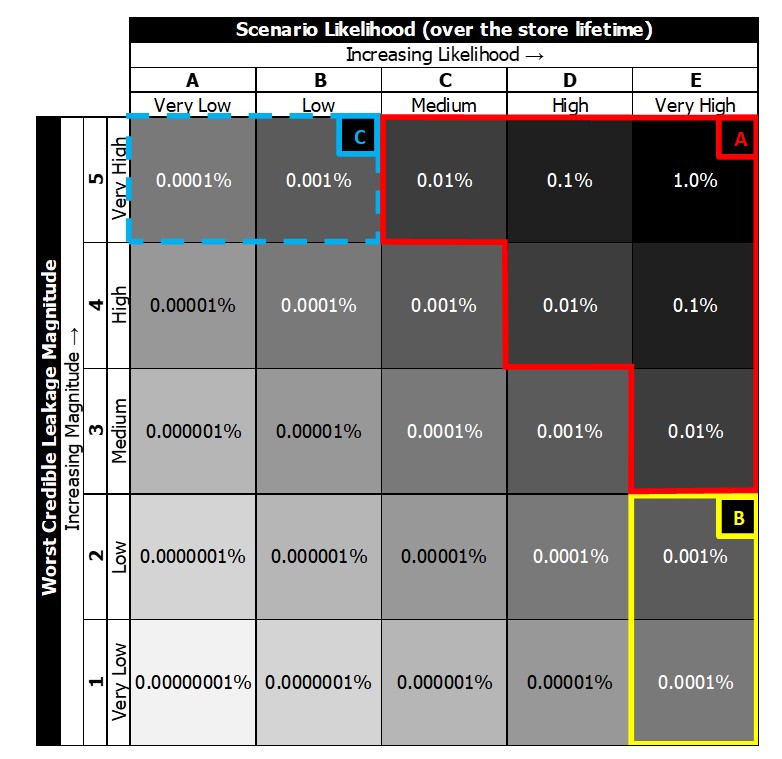
This framework supports proportionate assessment at different project stages. A purely qualitative register of leakage scenarios and safeguards is useful for early screening, but on its own is unlikely to be sufficient to demonstrate that leakage risks are not significant. At the other end of the spectrum, fully quantitative leakage risk analysis may be justified for selected scenarios, for example where the significance judgement is finely balanced, but it should not be treated as a default requirement where supporting data are sparse or the methods remain immature. For most storage projects, a semi-quantitative leakage matrix of the type illustrated in Figure 5 is likely to be proportionate because it is transparent, auditable, and regulator-friendly.
Uncertainty should be shown explicitly rather than concealed within conservative assumptions. In practice, this means presenting ranges for leak rates and durations, stating the confidence in subsurface and well-integrity models, and identifying where monitoring detectability limits affect confidence in the conclusions.
MAKING A QUALITATIVE TEST A NUMERIC DISCPLINE
No storage site can be guaranteed to be permanently 100% secure, i.e. leakage is not solely a symptom of poor site development and operation; but rather a feature of subsurface storage that must be anticipated and shown not to be significant. It follows from the definition of significant risk that there must be some level of leakage risk that can reasonably be disregarded without undermining the purpose of regulated storage.
The goal-setting As Low As Reasonably Practicable (ALARP) approach to risk tolerability has long been applied in major hazard industries and uses familiar thresholds for intolerable and broadly acceptable levels of risk. Within that framework, risks falling within the tolerable region may be accepted, provided that all reasonably practicable risk reduction measures have been implemented. That logic is also useful in CCS, particularly in relation to structured risk reduction and barrier management, but it is not equivalent to the Directive’s ‘no significant risk’ test. In the context of an emerging CCS industry, where public confidence and risk perception may materially influence regulatory judgement, there is a legitimate concern that applying a pure tolerability framing (a reasonably practicable test) could blur the distinction between risks that are manageable and risks that are still significant. For this reason, the presence or demonstrable absence of significant risk is therefore more naturally treated as a go/no-go issue for project acceptability, which in turn explains the importance of defining what does, and does not, constitute a significant risk.
Although ‘significant’ within this context is a qualitative legal concept, numeric anchors are essential for comparability and disciplined decision-making. The IPCC indicates that appropriately selected and managed reservoirs are very likely (a probability of 90 to 99%) to retain more than 99% of stored CO2 over 100 years and likely (a probability of 66 to 90%) to retain more than 99% over 1,000 years. It also recognises that lower levels of retention may still carry climate change mitigation value; a fraction retained of the order of 90-99% for 100 years or 60-95% for 500 years could still be regarded as valuable. These benchmarks do not define the regulatory threshold, but they provide a credible reference point for discussion of what scale of leakage may start to call the climate purpose of storage into question.
These numeric anchors are best used as screening criteria, not as substitutes for judgement. For example, a retained fraction target, a maximum expected leaked mass as a percentage of stored mass, or a likelihood threshold for exceeding a leakage magnitude band may all help structure the argument. However, none should be used mechanically in isolation. A very small but probable leak (B in Figure 5) may erode confidence even if the cumulative leaked mass is limited; equally, an extremely large but vanishingly improbable scenario (C in Figure 5) should not automatically make a project unacceptable. The test remains one of significance, not simple exceedance (on the magnitude or likelihood scales alone, or a combination of the two).
An iso-risk threshold, with high probability low magnitude scenarios ranked equally to low probability high magnitude scenarios (A in Figure 5) can be used as a defensible starting point.
Risk of leakage – as well as the other dimensions of risk – needs to be considered in aggregate across all scenarios and across the lifetime of the store. For harm-based dimensions of risk, this is commonly addressed through annualised risk criteria that are cumulative across all scenarios (e.g. Individual Risk Per Annum, IRPA, as a measure of fatality risk in a Quantitative Risk Assessment, QRA), with scenario-based thresholds or matrices calibrated to align broadly with those underlying societal, regulatory, or company tolerability limits.
Leakage risk is different because leakage scenarios may unfold over very long timescales, with multiple distinct scenarios arising at different stages in the life of the store. What matters is therefore not only the significance of individual scenarios in isolation, but the cumulative loss of containment over the lifetime of the store. This is where the limitations of a simple scenario-based matrix become apparent.
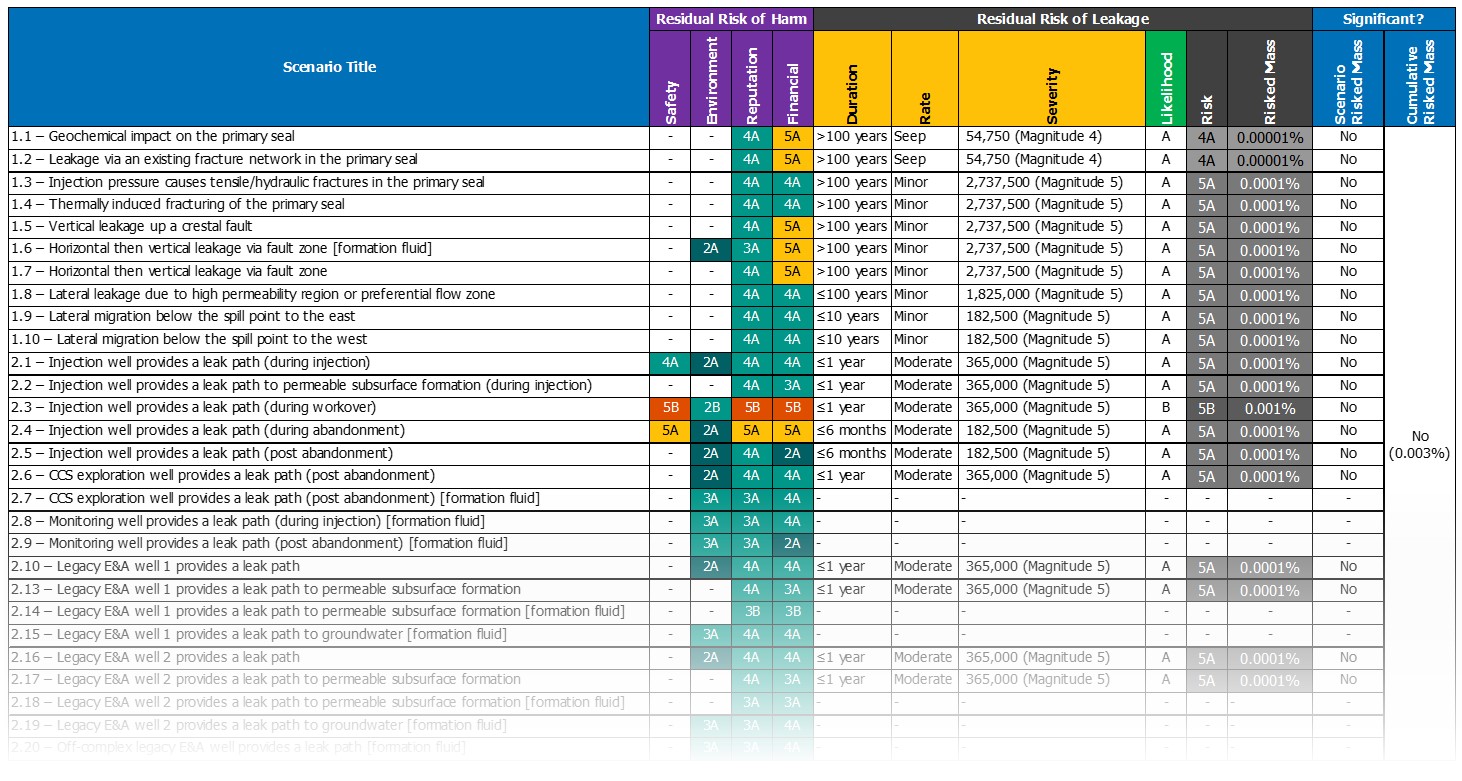
Provided that scenarios have been defined at a consistent level of granularity, a practical approach is to: define leakage scenarios consistently across the storage system; calculate an expectation value for each scenario (i.e. risked mass); sum these values, checking for artificial grouping, overlap, or double counting; and present the aggregate result alongside a retained fraction estimate and uncertainty range for the full lifetime of the store (Figure 6).
This avoids the common pitfall of relying on scenario-based matrices alone, and instead requires the results to be converted into a project-level risk estimate that can be used to support a containment argument for the storage project.
A PRAGMATIC ROUTE TO DEMONSTRATING ‘NO SIGNIFICANT RISK’
A practical demonstration of ‘no significant risk’ should proceed as follows:
- Define separate significance criteria for leakage, human health, and environmental harm.
- Identify leakage pathways and scenarios across the full lifetime of the store (wells, faults, caprock, operational upsets, etc.).
- Assess leakage scenarios using leak rate, duration, and likelihood, with separate assessment of any associated health or environmental harm and likelihood.
- Use quantitative modelling where needed, and/or published leak data where available, to estimate cumulative retained fraction, store lifetime expected leakage, and uncertainty ranges.
- Test whether any individual scenario or aggregate project risk profile is large enough, likely enough, or uncertain enough that it cannot reasonably be disregarded.
- Demonstrate that barriers, monitoring, surveillance, and corrective measures are sufficient to support the conclusion and that the argument is robust to regulatory and public scrutiny.
- Maintain active dialogue with the competent authority so that assumptions, thresholds, and interpretation of significance are aligned as the project matures.
This approach retains the Directive’s threshold logic while still making use of familiar major hazard disciplines such as structured hazard identification, barrier thinking, and proportionate risk reduction.
TAKEAWAYS
In an early-stage CCS market, significance is not purely a technical question. It is also a socio-regulatory judgement shaped by public trust, comparability across projects, legal defensibility, and the credibility of CCS as a climate change mitigation measure. If the threshold is interpreted too loosely, confidence in permanent storage will be undermined. If it is interpreted too conservatively or opaquely, viable projects may be deterred, which has its own environmental and societal consequences.
The solution is not to replace judgement with a single number; the semi-quantitative approach proposed is one input into an inherently judgement-based decision. Rather, transparent numeric anchors, explicit uncertainty treatment, and a dedicated leakage assessment framework help regulators and operators distinguish between what is theoretically possible and what is materially significant. That is a practical route to demonstrating no significant risk of leakage under the EU CCS Directive.
REFERENCES
- European Parliament and the Council of the European Union. Directive 2009/31/EC of 23 April 2009 on the geological storage of carbon dioxide
2009 - European Commission. Legislative Framework, Climate Action – Industrial Carbon Management
Webpage, accessed March 2026. - Intergovernmental Panel on Climate Change. IPCC Special Report on Carbon Dioxide Capture and Storage – Technical Summary
2005 - North Sea Transition Authority. Containment Risk Assessment, Carbon Storage Stewardship Expectation 1
September 2025 - van Egmond, S. and Hekkert, M.P. Analysis of a Prominent Carbon Storage Project Failure – The Role of the National Government as Initiator and Decision Maker in the Barendrecht Case
International Journal of Greenhouse Gas Control, Vol. 34, pp. 1-11, 2015 - Porthos, Project, including permitting timeline, irrevocable storage permits and final investment decision, 2023-2026.
- Dütschke, E. What drives local public acceptance – comparing two cases from Germany
Energy Procedia, 4, pp. 6234-6240, 2011 - International Organization for Standardization. Risk management – Guidelines
ISO 31000:2018, 2018 - Health and Safety Executive. Reducing Risks, Protecting People: HSE’s decision-making process
HSE Books, 2001