Barrier Management – Driving process safety improvement
Industrial facilities in the process sectors have many barriers in place to prevent or limit the effects of a major accident. But how do we know that these barriers continue to perform their intended function every day, month and year? What information do we need to gather and how can that be displayed effectively?
Internationally acclaimed academic and author Professor Andrew Hopkins, in his capacity as an expert witness at the hearing into the Longford gas explosion of 1998, observed that: “prior to any disaster there will always be information somewhere within an organisation that trouble is brewing”, (Ref. 1).
He expanded, “critical information must not be allowed to lie around unrecognised, ignored or buried like some landmine waiting to be triggered. The challenge is to find ways to assemble this information and move it up the hierarchy to the point where it can be understood and reacted on responsibly”.
PROCESS SAFETY INFORMATION
The assembly of information relating to safe operation of a facility is crucial, as highlighted by Professor Hopkins, and can span many departments and disciplines within an organisation. This is often achieved through the implementation of a robust Process Safety Management (PSM) system, which provides a disciplined framework for managing the integrity of operating systems and processes that handle hazardous substances.
PSM systems are routinely employed within industry, in part driven by the various frameworks and regulations which exist in different jurisdictions, including OSHA PSM regulations (USA), COMAH regulations (UK) and Seveso III Directive (EU). A key component in assuring safe, efficient and reliable operations is the communication throughout the organisation of the critical information contained within the PSM system. A PSM system may be applied across your organisation but, more generally, how can you ensure that it is robust, it remains so, and that risks inherent in your operations are being appropriately managed?
The development of Key Performance Indicators (KPIs), or metrics, can play a valuable role in revealing the strengths and weaknesses of a PSM programme, and help an organisation work towards achieving and maintaining outstanding process safety performance. This is of particular importance when addressing the identification and control of major accident hazards.
SO WHAT DO WE NEED TO KNOW?
At a foundational level, a robust PSM system should allow us all to answer the following critical questions:
1. What could cause us harm?
What are our major hazards that could lead to a potential incident?
2. What will protect us?
What are the critical barriers (safeguards) we rely upon to control these risks?
3. How do we know?
Are we confident the barriers will function as designed when required? What is the minimum level of performance required? Are these critical barriers available and effective throughout the life of our asset?
A GLANCE INTO THE FUTURE
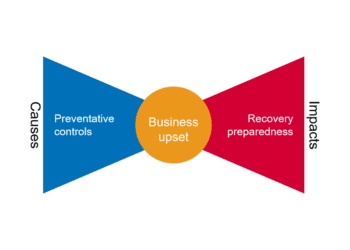
The first two points are often achieved through the application of standard risk assessment methods (e.g. HAZID, HAZOP, LOPA, bowtie analysis, etc.) whereby hazards are identified, consequences defined and the barriers preventing or mitigating the scenario documented.
This approach determines whether the risks are being appropriately managed. But this determination is like a photograph, a representation that was valid only at the time it was taken. Point 3 challenges us further – how do we assure ourselves that these risks continue to be managed to an acceptable level throughout the lifecycle of a facility? How do we know there isn’t a “landmine waiting to be triggered”?
BARRIER MANAGEMENT SYSTEM
The concept of barrier management helps us address this concern. The Norwegian Petroleum Safety Authority (PSA) states the purpose of barrier management is “to establish and maintain barriers so that the risk faced at any given time can be handled by preventing an undesirable incident from occurring or by limiting the consequences should such an incident occur “, (Ref. 2).
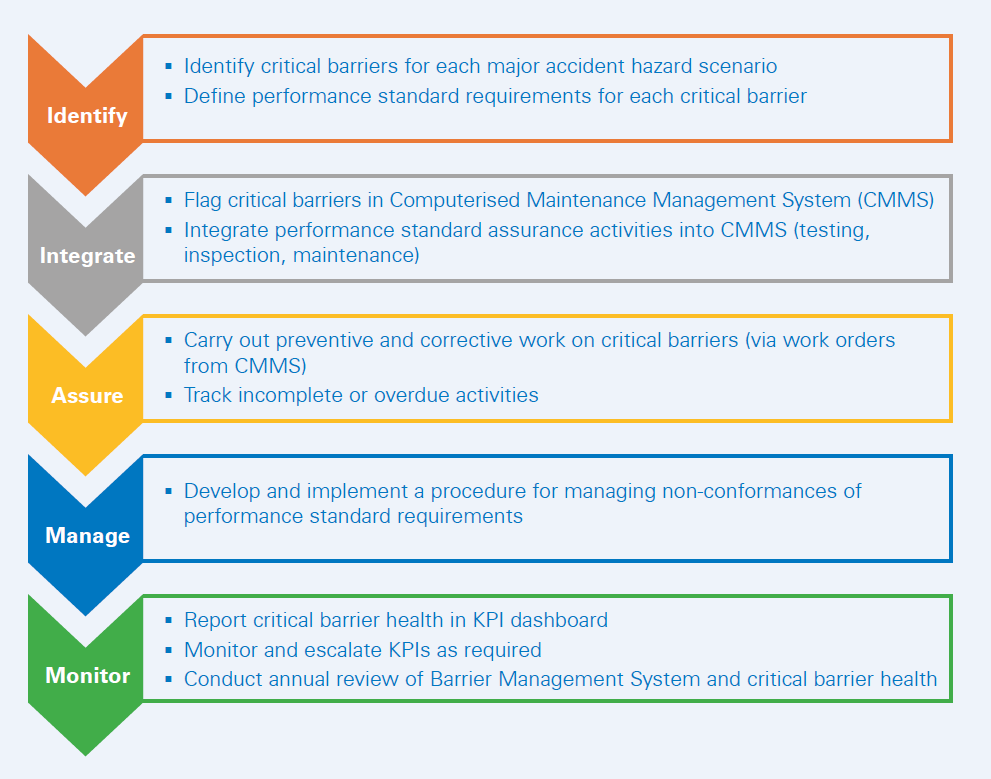
We can provide a level of assurance in the continued effectiveness of our critical barriers by defining minimum testing, inspection and maintenance requirements. The oil and gas industry typically captures such requirements within a performance standard for each critical barrier, but the basic logic holds regardless of application. Figure 1 provides an example flow diagram outlining how a barrier management system can be implemented for the control of major accident hazards.
KPIs
The ongoing health of critical barriers can be monitored though the use of a KPI dashboard, which can inform whether:
- Identified preventive maintenance (PM) tasks are being completed on time
- All requirements of the performance standard are being met for each critical barrier
- The responsible or accountable persons are taking ownership of the critical barriers
Example metrics tracked on a dashboard can include:
- Status of assigned testing and inspection (complete, due, overdue)
- Status of PM and any noted nonconformances
- Critical barrier PM backlog
- Number of PM tasks completed on safety-critical equipment (per time period, per critical barrier type, etc.)
A range of modern business intelligence tools may be leveraged to sustainably build a KPI dashboard, notably Radiant360, PowerBI, Scoro and Datapine. Data can be fed in real-time from the Computerised Maintenance Management System (CMMS) to populate the dashboard.Figure 2 provides an example of how a set of barrier health metrics can be displayed in a simple, highly impactful way within a dashboard.
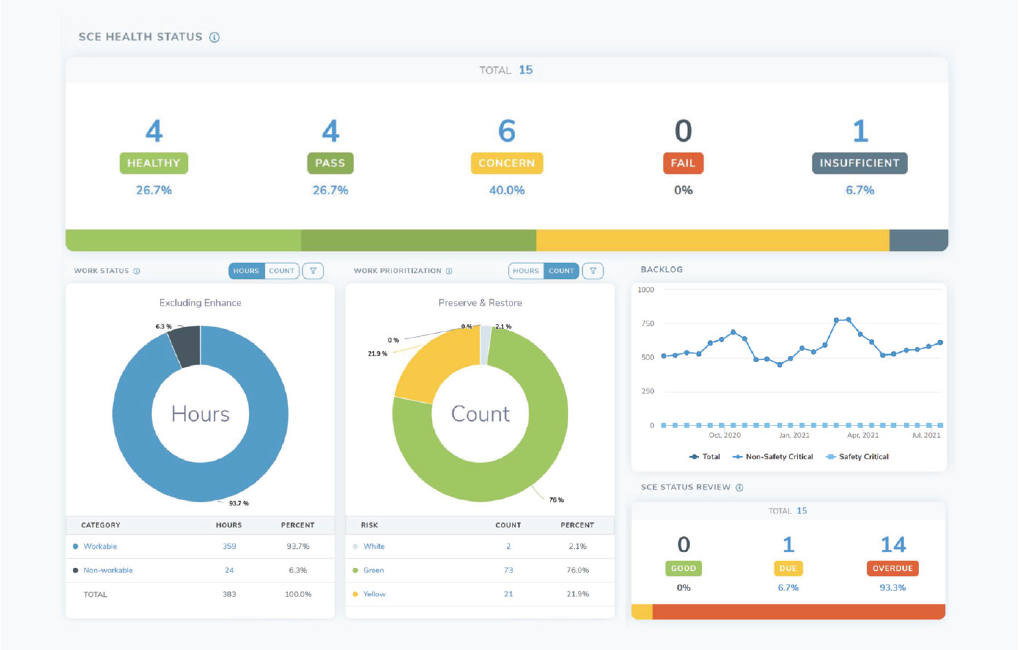
The dashboard is accessible to all key personnel, including process unit and asset managers. They would typically interrogate the dashboard on a weekly basis to determine whether the health of the safety-critical equipment is deteriorating and, if that is the case, they know where to focus resources to restore the equipment to good health.
CONCLUSION
The Longford explosion highlighted a deficiency in the way in which many organisations collect and communicate key process safety information. The definition and application of KPIs can help an organisation ensure efficient assembly of this information and, more importantly, highlight and communicate this information up the management chain where it can be acted on responsibly.
The barrier management approach, coupled with a live KPI-based dashboard, enables risks inherent in an organisation’s operations to be better understood and hence proactively managed, not only today but through-life.
This article first appeared in RISKworld 41, issued April 2022.
References:
1. Lessons from Longford: The Esso Gas Plant Explosion, Hopkins, 2000
2. Principles for Barrier Management in the Petroleum Industry, PSA, 2013