An introduction to physical effects consequence modelling
PHYSICAL EFFECTS
Physical effects can cause serious harm to people and the environment, and damage structures and equipment. In the oil, gas and petrochemical sectors, the physical effects arising from the accidental release of hazardous gases, vapours or liquids include:
- Gas dispersion (which could be flammable, toxic or both)
- Jet fires and pool fires
- Flash fires
- Explosions
- Boiling Liquid Expanding Vapour Explosions (BLEVEs)
- Smoke dispersion
- Subsea dispersion
- Dispersion of oil on water
- Tank fires
In order to effectively manage the risks from these physical effects, it is important to first understand their consequences and implications.
Various techniques are available for modelling the physical effects, ranging from simple equations to empirical software tools based on physics that have been correlated against experimental testing data. The most sophisticated models involve 3-dimensional (3D) computational fluid dynamics (CFD) simulation.
MODELLING
The three general steps involved in conducting physical effects consequence modelling are illustrated in Figure 1.

Figure 1 – Three steps to physical effects consequence modelling
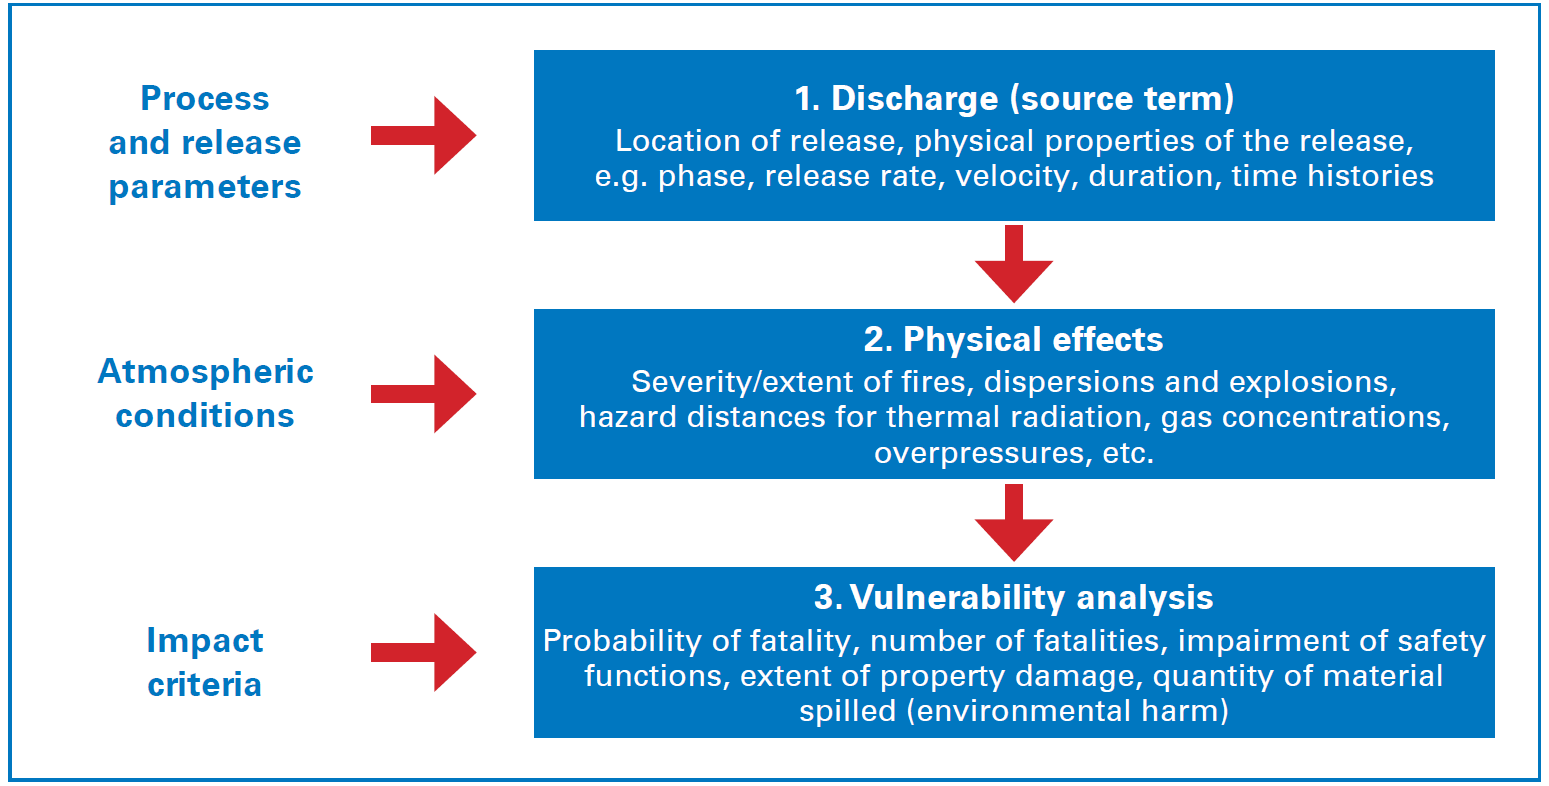
Step 1 – Discharge
The plant is divided into isolatable sections using Piping & Instrumentation Diagrams (P&IDs) or Process Flow Diagrams (PFDs) to locate those valves which will isolate inventories during an emergency situation. The location of each potential release within an isolatable section is then determined by the location of equipment which could provide the release path, e.g. flanges, valves, vessels, etc. The cause of the release is not important to the study.
The process and release parameters for each of the identified scenarios are specified, such as composition of the material, storage pressure and temperature, as well as the size of the hole in the equipment through which the release occurs. These are then input into the physical effects model. The composition determines flammability or toxicity (or both), while the temperature and pressure determine if the release is liquid, gas or 2-phase (a combination of liquid and gas), and the hole size determines the release rate and velocity.
The output from the model describes the ‘source term’, i.e. the physical properties of the release (e.g. phase, release rate, velocity and duration) at the point location of the release. More sophisticated modelling can assess detailed time histories of these parameters rather than simple duration.
Step 2 – Physical effects
The next step is to input the source term into further physical effects models to determine the extent of the resulting dispersion and potential fires and explosions. The outputs are usually either in the form of distances to specified levels of thermal radiation, gas concentration and explosion overpressure, or in terms of the predicted magnitude of these physical effects at locations of interest; for example, if people are located here, how much heat will they experience from the fire?
Physical effects can vary greatly depending on the local atmospheric conditions, e.g. wind speed, atmospheric stability, air temperature and solar radiation. In particular, gas dispersion distances are heavily affected by wind speed and atmospheric stability – the more stable the conditions, the further a gas cloud will disperse. Ambient temperature can affect flashing liquids and the rate of pool evaporation. Atmospheric humidity affects the transmission of heat from fires. It is important to therefore choose a set of conditions that are representative of local weather data.
Modelling is often performed using conservative inputs (e.g. worst case pressures and compositions) because if the worst case is acceptable then anything less is also acceptable. However, the cumulative effect of multiple worst case assumptions can be extremely pessimistic, and care must be taken to ensure that each scenario is credible.
Not all of the input data will be well defined and some assumptions will inevitably have to be made. As with any quantitative modelling, all assumptions should be recorded – an ‘assumptions register’ is a good vehicle for doing this. Whilst physical effects modelling is one of the more accurate risk-related quantitative techniques because the models are based on experimental data from real releases, care must be taken to not use the models outside the limits of their validity.
Sensitivity analysis is an appropriate technique for assessing the impact of uncertainty in the input data and modelling assumptions. It provides an awareness of which inputs and assumptions have the greatest effect on the results and helps to ensure
any decisions made are based on a solid understanding of the inherent uncertainties.
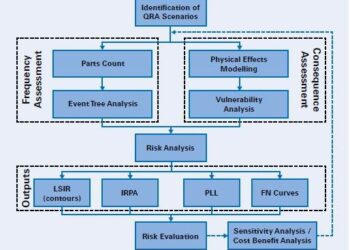
3. Vulnerability analysis
Having determined the severity of a release scenario, impact criteria are then used in a vulnerability analysis to translate the physical effect, e.g. explosion overpressure, into a probability of impact on people, structures/equipment or the environment, e.g. fatality, cost or damage. The vulnerability of people depends on the extent of shelter and protective clothing, and a worst case first estimate would often assume no shelter and no protection.
Impact criteria can be in the form of lookup tables, e.g. someone outdoors exposed to an explosion overpressure greater than 0.5 bar has a 50% chance of fatality, or in terms of mathematical relationships called probit functions. Deriving the impact in this way means it can be combined with frequencies of occurrence to determine numerical risks as part of a Quantitative Risk Assessment (QRA).
USES
Once the consequences of the physical effects have been modelled and understood, the results can be used to help manage facility risks by considering decisions such as:
- Classifying hazardous areas
- Siting buildings and specifying appropriate protection against overpressure, thermal radiation and gas ingress
- Optimising site layouts and separation between units
- Locating vents
- Determining flare heights and assessing flame-out scenarios
- Locating fire and gas detectors
- Providing fire and blast protection and specifying design requirements
- Locating and protecting onsite muster points, temporary refuge and escape, evacuation and rescue equipment
- Impacts on offsite populations and arrangements for offsite evacuation
- Land use planning restrictions on development around facilities
- Emergency response planning
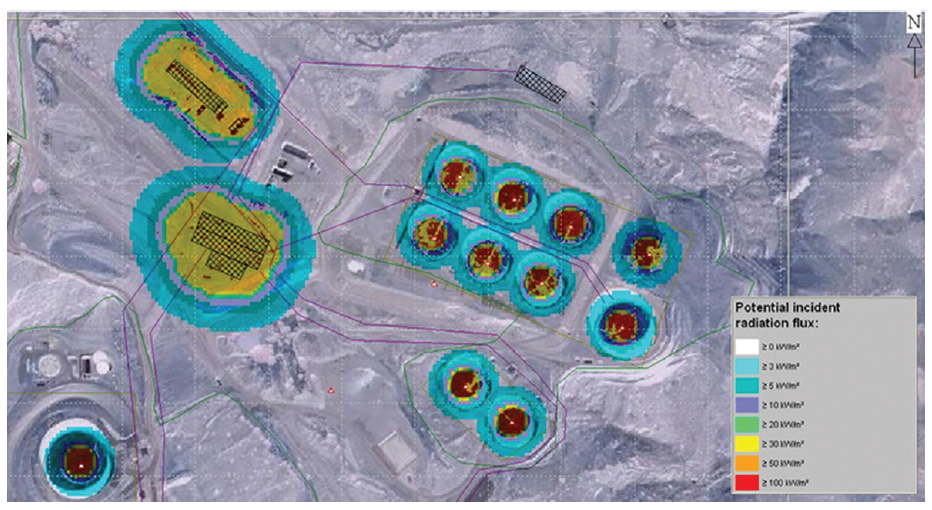
For example, the plot plan in Figure 2 would help when planning the location of new tanks or buildings, to ensure they are located far enough away from potential sources of fire. Or, for existing tanks, the modelling could be used to identify areas where passive fire protection, or cooling water deluges, are required to prevent escalation of fire events from one tank to another.
Figure 2 – A plot plan of a tank farm showing thermal radiation levels from hydrocarbon fires
CONCLUSION
Physical effects modelling techniques range from data correlations and empirical formulae, to complex 3D CFD models. The modelling has a wide range of applications and forms an input to many key decision-making processes for the management of risk at a facility.